
One of the most daunting tasks for many students training to be pilots is the mastery of performance charts. And one of the most-forgotten skills of experienced pilots, in my experience as an instructor, is calculating aircraft performance.
Often in training there is no clear connection made between the calculation of aeroplane performance and the evaluation of actual performance relative to those calculations once the aircraft is in motion. The disconnect between the theory and reality of performance charts, I believe, gives rise to several myths. Let’s explore some of the myths, and the realities, of aircraft performance charts.
Test pilot in a new aeroplane
One persistent myth is that aircraft performance charts do not reflect reality for most pilots, because the charts were created by professional test pilots flying brand-new aeroplanes with brand-new engines.
A look at the rules for aircraft certification (US Federal Aviation Administration rules, because many light aeroplanes were certified and built in the US) tells us something a bit different. In the US, 14 CFR 23.45 says, ‘In determining the take-off and landing distance, these procedures must be able to be executed consistently by pilots of average skill in atmospheric conditions reasonably expected to be encountered.’
There is no FAA standard for a pilot of ‘average skill’. My subjective interpretation is that an ‘average’ pilot is one capable of flying to the standards necessary to pass a flight test. Are you good enough to pass your test again today without special preparation? If yes, you should be able to get ‘by the book’ take-off and landing performance.
The aircraft is indeed new when the performance tests were flown. If the aeroplane you’re flying isa little out of rig or has had extra aerials fitted, then you might take a little more time to accelerate for take-off and have a lower climb angle and longer time to climb than the handbook suggests. When the aircraft passes the annual inspection, it has been declared to conform with its type certificate and any Supplemental Type Certificates as well. So the aeroplane should be able to get close to its brand-new performance.
How about the engine? An engine that passes scheduled inspections should be capable of developing its full-rated power – there should be no loss of power development with age. But if, for example, you add engine-driven accessories, the engine will get less power. If your fuel flow is not set precisely to factory specifications (including manual leaning for altitude as needed), power output will be lower; this is as critical when fuel flow is too great, as it is if it is too low. A different propeller will turn power into a different amount of thrust. These variations will all impact actual performance, mostly negatively.
There is no chart predicting performance for what most pilots would consider to be a ‘normal’ take-off or landing.
So thinking your actual performance cannot be as good as ‘by the book’because you’re not a test pilot flying a brand-new aeroplane and engine, is mostly a myth. The rules under which performance charts are created assume ‘average’ pilot skills.
Associated conditions
At some point during your initial training you likely got passably good at computing aeroplane performance using charts in the pilot’s operating handbook (POH) or aircraft flight manual (AFM). But did you realise that to obtain the performance listed in the handbook, you must fly precisely using handbook technique?
For example, the short-field take-off chart for the C172S at maximum weight requires setting flaps to 10°, coming to full throttle before releasing the brakes, using a paved, level, dry runway in zero-wind conditions, aggressively pitching up on reaching 51 knots indicated airspeed (KIAS) (only 7 knots above stall speed with 10° flaps), then be accelerating through 56 KIAS (1.3 times stall speed with the first notch of flaps) as you climb steeply through 50 feet above ground level.
Similarly, the conditions for short-field landing call for full flaps, power idle and 61 KIAS passing through 50 feet AGL and ‘maximum braking’ on a paved, level, dry runway in zero wind. Both charts include adjustments for wind or a dry grass runway. But there is no chart predicting performance for what most pilots would consider to be a ‘normal’ take-off or landing. Be assured, it will not be as good as what’s in the handbook.
As another example, the Beech A36 Bonanza POH take-off chart requires full power before brake release, pitching up to an attitude that has the aircraft at VX adjusted for weight when passing 50 feet AGL and a paved, level, dry runway. Landing performance requires decelerating through 1.3 times VS0 adjusted for aeroplane weight, and power reduced, to result in a 900-foot-per-minute rate of descent, at that 50-foot point, followed by maximum braking.
Beech provides no adjustments for grass or sloping runways and, although the POH doesn’t identify it as such, these are maximum performance, short take-off and landing techniques.
Neither handbook provides performance data for a ‘normal’ take-off or landing – a reality that gives rise to a pervasive myth that handbook take-off and landing distance charts are
‘optimistic’ or ‘created by the marketing department’.
Cruise
Cruise performance charts, in my experience, tend to be extremely accurate – if you manage the engine to handbook assumptions. In most aircraft, cruise fuel flows are based on leaning the engine to 25° F (US-made aircraft use Fahrenheit) rich of peak exhaust gas temperature (EGT) for fuel-injected engines, or by reducing fuel flow until the engine runs roughly and then enrichening until the engine smooths out with carburetted engines.
Set the power and lean per the book – and the airspeeds and fuel flows tend to be spot on. But many pilots lean differently. If you run richer, airspeed will increase slightly but endurance will decrease. On the lean side of peak EGT, fuel flow decreases but airspeed will drop, perhaps substantially.
The second myth is that a crosswind less than the maximum found on the chart is not hazardous.
The myth that cruise performance charts do not reflect true performance is mainly the reality that pilots do not adhere to the operating assumptions on which handbook performance is based.
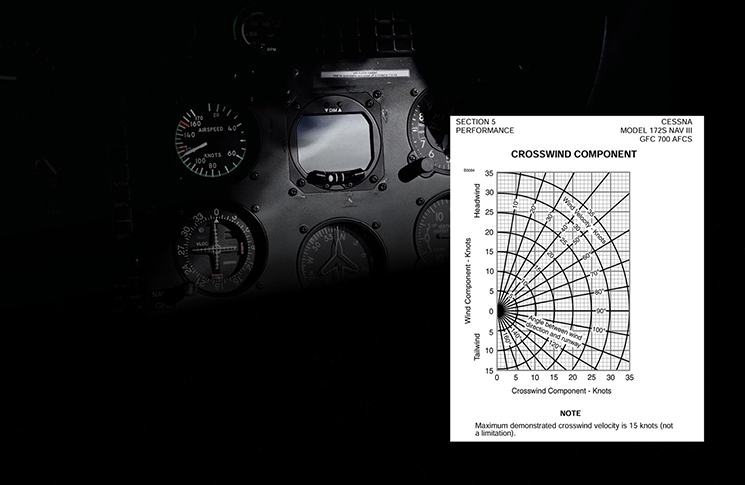
Cessna 172S POH. The chart specifically states this maximum is ‘not a limitation’.
Maximum crosswind component
Two persistent myths surround the crosswind component chart found in most POHs and AFMs. The first is that this chart represents a maximum – that the aeroplane is incapable of resisting any crosswind component in excess of the maximum listed on the chart.
Regulatory requirements (again, US rules) call for establishing a maximum demonstrated crosswind during aircraft certification. Under these rules, a test pilot must demonstrate the ability to offset a 90-degree crosswind of not less than 0.2 VS0, the stalling speed in the landing configuration.
Here’s my theory: light winds permit sloppy pilot technique – at least in tricycle gear aeroplanes.
Manufacturers have the option of testing crosswind control to a higher speed if they wish. Living in Kansas USA, where many light aeroplanes were tested for type certification, I can confirm that a test pilot may easily encounter a higher crosswind while conducting other phases of certification flight test. If they do, the manufacturer will likely use that crosswind value. Let’s look at 3 examples:
- The Cessna 172S has a published VS0, full-flaps stall speed at maximum weight, of 48 knots calibrated airspeed (KCAS). At a minimum, the demonstrated crosswind component (0.2 VS0) is 9.6 KCAS. However, the type’s published maximum demonstrated crosswind component is 15 knots, more than 50% greater than what the regulation requires. The POH crosswind chart specifically states that this maximum is ‘not a limitation’.
- VS0 for the Cirrus SR22 is 64 knots indicated airspeed (KIAS). The regulatory requirement for demonstrating crosswind control is 12.8 knots. However, the published maximum demonstrated crosswind velocity is 21 knots. The Cirrus handbook states the demonstrated crosswind ‘is not considered to be limiting’.
- VS0 for the Beech 58P pressurised Baron is 77 KIAS, meaning its demonstrated crosswind component must be at least 15.4 knots. However, that Baron’s published demonstrated crosswind component is nearly twice that – 30 KIAS. Here’s my theory: light winds permit sloppy pilot technique – at least in tricycle gear aeroplanes.
Additionally, in crosswind certification tests, the aircraft ‘must be satisfactorily controllable in power-off landings at normal landing speed, without using brakes or engine power, to maintain a straight path until the speed has decreased to at least 50% of the speed at touchdown.’ In other words, the aeroplane must be able to counter crosswinds with aerodynamic controls alone, not assisted by braking or, in multi-engine types, asymmetric power, at least in the first half of deceleration.
The second myth is that a crosswind less than the maximum found on the chart is not hazardous. I’ve done a lot of my own primary research and found the reality is that, when loss of directional control on the runway is found to be the probable cause of a mishap, in most cases investigators found the crosswind component to be under 10 knots.
Here’s my theory: light winds permit sloppy pilot technique – at least in tricycle gear aeroplanes. Strong crosswinds make us think about it and work at it – or decide to delay take-off or divert to land somewhere else. It’s in the moderate crosswinds – 7 to 10 knots crosswind component – where maybe we don’t think it’s a big deal or don’t work at it so hard, only to find they’re not as forgiving as we think.
Takeaways for the myth and reality of the crosswind component chart: any crosswind component is hazardous if we don’t actively manage the aircraft and apply crosswind control techniques. Usually, it is the pilot’s ability that is limiting, the aeroplane itself being more capable if flown correctly.
Margin of safety
In private aircraft operations, with the exception of information contained in Section II Limitations, data in the POH/AFM is not regulatory or mandatory. Instead, the remainder of the handbook – including performance charts – is the manufacturer’s best recommendation as to how to operate the aircraft under the conditions described. There will always be variations in aeroplane condition, environmental factors and most notably pilot technique that call for applying a healthy margin of safety to the results of performance chart calculations.
Personally, for take-off and landing performance, I use the 50-foot obstacle distances (and not the ground roll distance) as the basis for my minimum acceptable runway length. I increase that distance 50% if I use the book, short- field techniques called out on the performance charts, and 100% if I plan on a more normal take-off or landing technique. To that I’ll add what adjustments I must for contaminated runways, grass or unsealed landing surfaces, and runway slope. If I find these adjustments make my margins too small, I’ll employ other mitigations, like reducing aeroplane weight, waiting for cooler air temperatures, cancelling a take-off or diverting to land elsewhere.
The myths about performance charts abound. The reality is that most manufacturers produce accurate performance data, if you use the techniques and assumptions that go into creating the handbook charts. In all cases, approach the edges of performance margins carefully and cautiously, practising the technique where the margin of safety is greater,
before trying something that just barely fits within the calculated performance envelope.


