When flying in summer, be extra cautious about calculating density altitude and keeping well away from storms
By Thomas P Turner
I fly out of 3600-foot (1100 metre) runways in an A36 Bonanza all the time back home in Kansas, where the field elevation is about 1500 feet.
But an 1100-metre dirt airstrip at 1410 AMSL in the Flinders Ranges, from the right seat of a friend’s A36 that was loaded well within its limits but with four aboard and a little baggage, still looked a bit tight—especially since we’d been delayed leaving Wilpena Pound that morning. At 11 am, the temperature was already getting up near 30 degrees. Calculating the density altitude, I found it wasn’t a big deal—only about 3600 feet, very comfortable for a Kansan. The density altitude reaches 4500 feet or higher on a typical summer day where I fly.
However, even at the comparatively low-density altitude for our Rawnsley Park departure, it makes a big difference if you properly accommodate the reduction in performance brought on by temperature. Less-dense air means less potential for power development in normally aspirated airplanes—most piston engines must be leaned for high-density altitude take-offs.
Turbocharged engines are affected too, because turbos compress the air further, heating it more. Even turbine engines are affected. Whether normally aspirated or turbo’d, piston or turboprop, propellers are less efficient at turning power into thrust in thinner air.
In our case, with a normally aspirated engine, we needed to lean for maximum horsepower for take-off. There are three generally accepted ways to do this, and a fourth which, although it receives less attention in most training, is an even more accurate way to obtain take-off power at a high-density altitude.
The usual ways to lean for density altitude are:
Propeller speed.
In an aeroplane with a fixed-pitch propeller, advance the throttle to full. Then lean the fuel mixture, watching the RPM increase as the engine becomes more efficient. Eventually the RPM will begin to decrease again; adjust the mixture to attain the maximum RPM.
Exhaust gas temperature.
If your aeroplane has an EGT gauge, at full throttle lean until EGT peaks. Then enrichen EGT until its temperature drops 75 F to 100 F, that is, a comparable difference of about 40 C to 50 C rich of peak EGT. This is a maximum horsepower mixture setting.
Fuel flow.
Many Pilot’s Operating Handbooks and even cockpit fuel gauges or placards recommend specific take-off fuel flows for various altitudes (Figure 1). Power up, lean to the fuel flow, and go.
The lesser-taught fourth method:
Target EGT: This method will vary from one type of engine to another. In the engines common in Bonanza-class aeroplanes, maximum power comes at roughly 730 C exhaust gas temperature, rich of peak EGT. Go to full throttle, lean to the target EGT, and fly.
Leaning for take-off power does not mean you’ll attain the same horsepower you will at sea level. It means you’ll obtain the maximum available power under existing conditions—something less than at sea level on a standard day.

The typical heat and humidity in the north increase density altitude even at lower field elevations
But wait, there’s more
When air molecules are less densely packed, wings must travel faster to impact enough air to generate needed lift. True airspeeds are higher for a given indicated airspeed—take-off distances increase. Translating this into take-off action, anticipate a longer take-off roll, not only because the engine is developing less power, but also because the propeller is less efficient turning that power into thrust—you must accelerate longer to reach the faster true airspeed that results in the indicated airspeed you need for lift.
And be focused on flying the right airspeed. Indicated airspeed is an indirect measure of angle of attack, and even small changes in AoA create changes in drag, affecting performance. Power plus attitude equals performance; to fly the correct airspeed (performance) at reduced power means you’ll need a shallower attitude for liftoff and climb.
Vx (best angle-of-climb speed), Vy (best rate-of-climb speed) or your other desired initial climb requires a lower attitude than you’d use closer to sea level/standard conditions. If you pitch to the attitude you’d use along the beach, your AoA will be high and your airspeed low—increasing drag, decreasing performance and potentially nibbling at a stall.
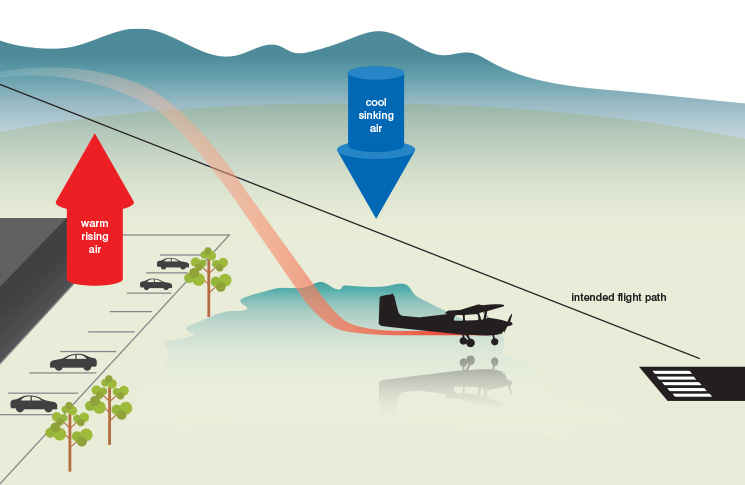
There are other hot-weather factors that affect take-off and climb performance. The first is convective turbulence. Dark areas like car parks and large buildings absorb solar radiation. This heats the surface—heat radiates to the air above and hot air rises. Lighter-coloured surfaces reflect the sunlight. Trees, grasslands and bodies of water do not heat as much, so the air above is cooler and descends.
Flying through successive areas of rising and descending air causes turbulence—and momentary reductions in climb performance. We have no charts to predict how performance may be degraded as a result of convection. We just have to give ourselves an extra-wide margin for safety for hot-day airport operations and obstacle-avoidance climbs.
Second, the air in the first couple of metres above a dark-coloured runway can be as much as 20 C hotter than the reported temperature. That’s the air your engine, propeller and wings are using to generate power, thrust and lift, so performance may be significantly less than even density altitude calculations suggest. If the ambient temperature is about 30 C or more, the sun is shining and the winds are fairly light, add 10 C to 20 C to the ambient temperature in your calculations and see if runway surface temperature performance is sufficient for you to fly.
A third factor is humidity. The air at Wilpena Pound was quite dry. During our time there, my friends, my wife and I discussed a flyaway to the Kimberley next time we come to Australia. Humidity displaces oxygen. The typical heat and humidity in the north increase density altitude even at lower field elevations. We’d have to accommodate density altitude up there as well.
Back at Rawnsley Park: Using the Target EGT method for power, we lifted easily off the red South Australian dirt, flew the proper airspeed at the adjusted attitude and, leaning as we climbed, made a circuit of the Pound before angling back toward Melbourne. Knowing how to accommodate density altitude works.
Thunderstorms
From an ATSB report:
A Cessna 210M [was en route] with four passengers from Darwin to Tindal, Northern Territory. Soon after departure, the pilot diverted 5 nm right of the planned track to avoid a large storm cell that was 5 nm left of track. About 10 minutes after departure, while maintaining 3500 feet, the aircraft encountered sudden and sustained severe turbulence. Control of the aircraft was lost for over three minutes, and three passengers sustained minor injuries.
We are taught to stay at least 20 nm or so from thunderstorms to avoid the threats of turbulence and hail. We have far better information for avoidance but may be tempted to use that data to sneak too close to a storm. However, that’s a very risky temptation. Here’s why:
20 nm from where?
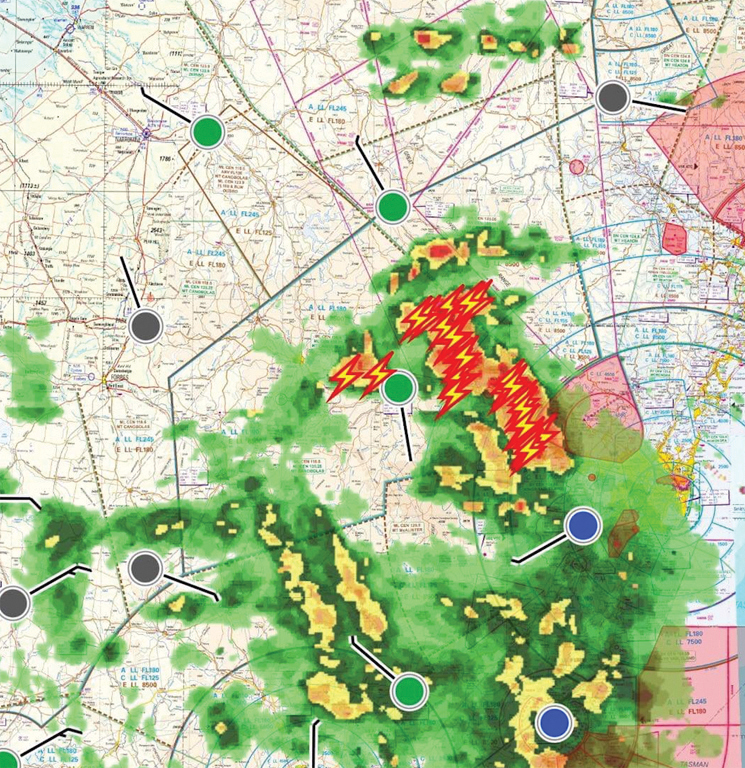
It’s easy to look at an uplink display and think, ‘As long as I stay out of the yellows and reds, I’m okay.’ After all, the greens indicate light precipitation. However, substantial turbulence is often found near storms but outside the yellow and red areas. This is because radar does not indicate the earliest but still dangerous phase of a thunderstorm’s development. Radar does not detect turbulence—it displays the precipitation that sometimes (but not always) coincides with areas of strong turbulence.
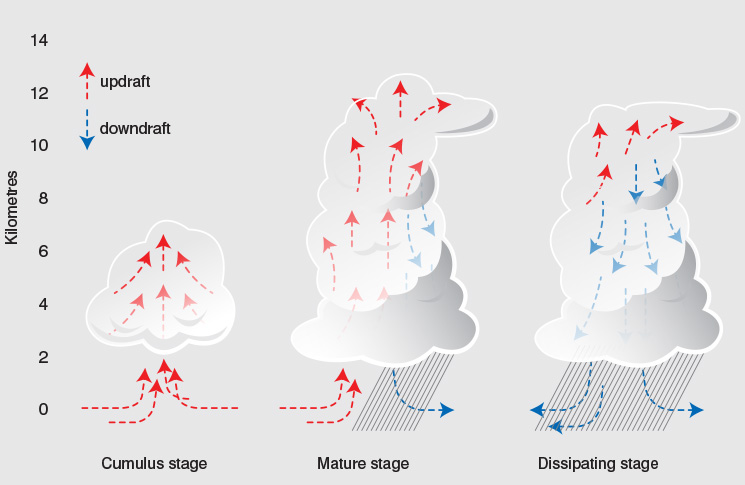
The three stages of a thunderstorm’s development are the cumulus or updraft stage, the mature phase and the downdraft or dissipating stage (Figure 2).

The mature stage of a thunderstorm is defined as starting when precipitation begins to fall from the cloud. But it’s turbulence, not precipitation, that is the hazard of flying near a thunderstorm.
The old advice about avoiding thunderstorm activity—to remain 20 nm from the edges of any storm cell’s radar return, and to stay in visual conditions if at all possible while doing so—is just as valid now as it was in the days before weather data uplinks and moving map displays. The true purpose of these technologies is not to help us penetrate areas of precipitation returns, it’s to make it easier for us to stay away.
It’s generally safe to fly through areas of light precipitation (‘green’ returns) if there is no moderate or greater precipitation associated with those clouds. However, if the clouds creating the precipitation are convective and there is any moderate precipitation in the radar plot (generally yellow), you need to remain at least 10 nm away from even the light (green) returns that surround the heavier precipitation.
If there is heavy (often, but not always orange or red) or extreme (darker red, white or other) precipitation in convection, remain at least 20 nm away from even the light (green) returns (Figure 3).
ATSB’s investigation and analysis of the Cessna 210 event confirms these recommendations:
At 10 nm from the thunderstorm, the pilot did not have sufficient separation to ensure safe passage … The primary protection against thunderstorm related turbulence is avoidance. In this case, 10 nm was not far enough (Figure 3).
Happily, those aboard the Cessna survived to help us learn from their experience.

The air in the first couple of metres above a dark-coloured runway can be as much as 20 C hotter than the reported temperature
Summer accommodation
To accommodate the hazards of summer flying:
Operate the aeroplane as light as possible. This maximises performance on the available power. You may have to make shorter flights and refuel more often to get acceptable take-off performance. CASA requirements for fuel reserve planning and inflight monitoring still apply.
Know how to attain maximum available power in the aeroplane you’re flying. Remember this is not full power—it’s the most power you can get under current conditions.
Apply a significant safety margin to computed take-off and climb performance. Unseen hazards like runway surface temperature, high humidity and convective turbulence during climbout can diminish performance even more than density altitude computations suggest.
Since performance (airspeed) is the result of power plus aircraft attitude, when density altitude reduces power, performance speeds require lower pitch attitudes than normal.
Avoid any clouds or precipitation returns that are part of a storm system producing moderate or greater radar echoes. Severe turbulence exists beyond the boundaries of yellow and red radar returns.
Weather data uplinks do not change aerodynamics. Don’t use weather data to fly closer to storms—use it to more accurately keep your distance.
Due to the nature of the system, BoM radar data is not real time and there is probably a delay of 5 to 10 minutes. Be aware of this when storm cells are moving quickly—the data might not give the exact position of the cell but will be very useful for gauging its direction and speed.


Comments are closed.